
The U.S. Department of Agriculture recently released an updated version of its Plant Hardiness Zone Map. It is the first update of the tool used to determine which plants are most likely to thrive in a specific geographic location since 2012.
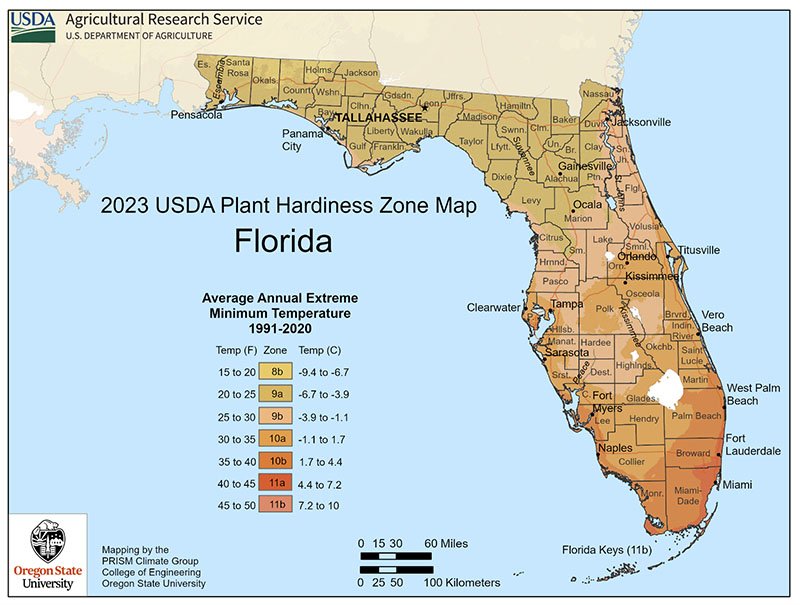
The updated map was developed by USDA's Agricultural Research Service and Oregon State University's PRISM Climate Group and is based on 30-year averages of the lowest annual winter temperatures at specific locations. It is divided into 10-degree Fahrenheit zones and further divided into 5-degree Fahrenheit half-zones by incorporating data from 13,412 weather stations, compared with the 7,983 with the 2012 map.
 According to the USDA, about 80 million people use the map at some point throughout the year.
The site also includes Tips for Growers that provides information about USDA ARS research programs.
Plant hardiness zone designations represent what’s known as the "average annual extreme minimum temperature" at a given location during a particular time period.
As with the 2012 map, the new version has 13 zones across the United States and its territories. Each zone is broken into half zones, designated as "A" and "B." The updated map reveals that about half the country shifted to the next warmer half zone.
These national differences in zonal boundaries are mostly a result of incorporating more data.
The annual extreme minimum temperature represents the coldest night of the year and varies by year and local weather patterns. Changes are a result of changing weather patterns as well as advancements in technology and improved data from more weather stations.