
i-Tree Canopy and Drury University Cover Assessment

Entry posted by Joseph Fearn
2,910 views
Drury University covers right at 100 acres in midtown Springfield, Missouri. If I had to summarize what Drury looks like, I would say it is a traditional landscape with primarily traditional architecture. When our community is asked to describe the campus landscape, most people remark on our many trees, and the park-like setting we reside in. Without a doubt, Drury University presents an image of a vibrant landscape that is in harmony with the built environment it resides in. In an effort to truly understand what the cover matrix of our footprint is, we decided to dig deeper than outward appearances.
What is i-Tree Canopy?
![]() i-Tree is a suite of software that was developed by the USDA Forest Service. These tools provide state of the art means to analyze the urban/rural forest and assess the benefits these areas provide. There are several tools for planning and monitoring the forest, and they all provide accurate scientific data. For this application we chose i-Tree Canopy. According to i-Tree, Canopy allows users to estimate tree cover and tree benefits for a given area with a random sampling process that lets you easily classify ground cover types. I suggest golf courses could also use canopy to measure greens, fairways, roughs, trees, etc. to determine ratios of those covers.
i-Tree is a suite of software that was developed by the USDA Forest Service. These tools provide state of the art means to analyze the urban/rural forest and assess the benefits these areas provide. There are several tools for planning and monitoring the forest, and they all provide accurate scientific data. For this application we chose i-Tree Canopy. According to i-Tree, Canopy allows users to estimate tree cover and tree benefits for a given area with a random sampling process that lets you easily classify ground cover types. I suggest golf courses could also use canopy to measure greens, fairways, roughs, trees, etc. to determine ratios of those covers.
How Does i-Tree Work?
To use Canopy, a user determines the area to be assessed and defines a sampling area. This software uses Google Maps and it is very easy to create boundaries in which the sampling will occur. For our plot, we outlined the entire footprint of our campus, even though our property lines can be irregular. One difficulty that may be experienced if your area is large is how close you are able to zoom the interface screen. But this was a minor concern. Once the boundaries are set the user determines cover classes (trees, buildings, etc.) and uploads these into the i-Tree file. Random points are generated and a simple drop down menu allows the user to assign each point a cover class. The more points you sample, the more accurate your assessment becomes.
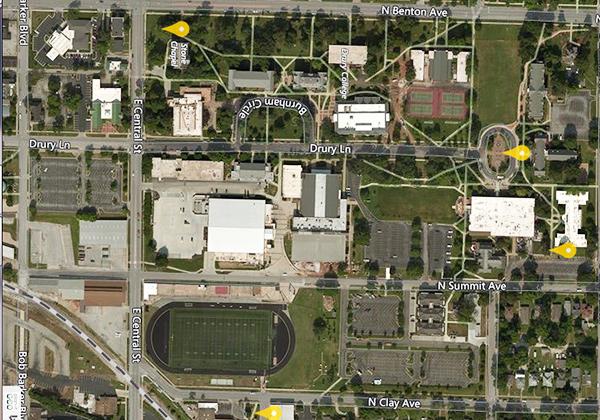
The heart of Drury campus represents 60% of its footprint and clearly illustrates its different cover classes.
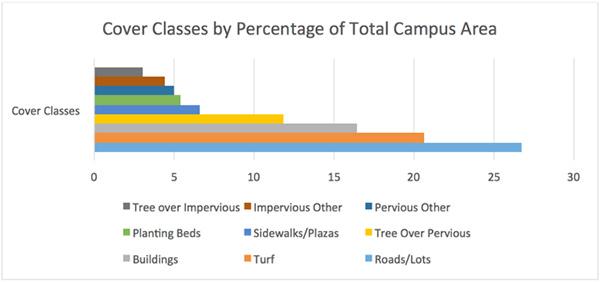
Cover Classes
In our assessment I created nine different cover classes. These were: Tree Over Pervious, Tree Over Impervious, Turf, Planting Beds, Roads & Parking Lots, Sidewalks & Plazas, Buildings, Pervious Other, and Impervious Other. These are reasonably self-explanatory but were defined because of our particular campus matrix. Any user can create a self-defined list, or use the standard one provided in Canopy.
Data
As of this writing I have plotted 500 points. This quantity gives me a range of statistical error from +/- 0.76 to +/- 1.98. I intend to plot 1000 points total and all of my statistical error should be under one. This may not satisfy MIT researchers, but will definitely suffice for my purposes.
Interpretation
As you can see, our largest cover class is roads and lots, representing 26.7% of our campus. Our impervious area is 57.13% when the impervious areas (roads/lots, buildings, sidewalks, impervious other, tree over impervious) are added together. Our tree canopy totals 14.81% and our turf area is 20.6% (this doesn't include turf under trees which is classified as Tree Over Pervious). Planting Bed areas represent only a fraction of the overall campus and significantly less than turf.
Implications
I don't have comparative institutions to measure Drury against, but when our biggest component is roads & lots, I don't think that is good. Granted, we are an urban campus, but Drury uses its landscape to sell itself as an aesthetic and sustainable campus. Drury cover matrix is significantly better than the typical mall or shopping center, but likely not as good as the matrix of a golf course, or recreational parks complex. Another benefit of this data is it gives us a point in time as a baseline that we can use to understand future changes. As we continue to develop our campus it will be vital that we determine what we want our mix of cover types to be.
0 Comments
Recommended Comments
There are no comments to display.